Working with Data
Loading Data
Report Manager expects a common URL for loading and saving data:
view:"reports", url:"remote/data"
More information on routes and parameters is located in the Working with Server article.
If you do not have a backend server or require non-standard logic, you can customize the Backend service.
Data Structure
Modules
Report Manager expects JSON data where each element of the array is an object with the following fields:
- id (number) - module ID;
- name (string) - module name;
- text (string) - string that contains module configuration. Can be converted into JSON;
- updated (string) - ISO date of the module last modification.
Data example
id: 22
name: "Company per region"
text: "{
    "desc":"Created on 10/28/2020",
    "data":"companies",
    "joins":[...],
    "query":"",
    "columns":[{"id":"companies.region_id","name":"Region",...],
    "group":{"by":[{"id":"companies.region_id"}],"columns":[...]},
    "buckets":
        [{"column":"sales.product","options":[{"id":"Drinks",
        "values":["black tea","espresso","latte","green tea"]},{"id":"Other"}]}],
    "meta":{"freeze":1},"sort":null}",
updated: "2020-10-29T12:38:14Z"
Data Services
Report Manager has the following services for data:
1. Local Data
- stores data on the client side in Data Collections
- provides methods for getting and manipulating reports (modules)
- provides methods for getting and manipulating models (data sources)
- provides methods for getting and manipulating queries
const local = $$("reports").getService("local");
const modules = local.getModules(); // returns available reports
2. Charts
- provides methods for getting chart types
- stores an array of colors to work with
const charts = $$("reports").getService("charts");
charts.getTypes(); // returns an array with chart type objects

/*
[
  {id: "line", value: "Line", icon: "mdi mdi-chart-line"},
  {id: "spline", value: "Spline", icon: "mdi mdi-chart-bell-curve-cumulative"},
  {id: "area", value: "Area", icon: "mdi mdi-chart-areaspline"},
  // other types
]
*/
3. Helpers
- provides methods for search and matching
const helpers = $$("reports").getService("helpers");
helpers.hasNonDigits(input); // checks whether input contains non-digits
4. Backend
- provides methods for issuing requests to the backend to fetch data and save the changes back
const back = $$("reports").getService("backend");
back.getModels().then((data) => console.log(data));
Study the models folder in the source code for method signatures.
Data Operations
Getting Modules
Module is a report configuration. All modules are stored in a DataCollection. The collection is accessible via the getModules() method of the Local Data service.
const modules = $$("myReports").getService("local").getModules();
To make sure that the data are already loaded, use the waitData method to wait for a data promise.
Getting a particular module
const modules = $$("myReports").getService("local").getModules();
modules.waitData.then(function(){
   modules.getItem(modules.getFirstId()); // get first module
});
You can get an array of all modules by serializing the collection:
Serializing modules collection
const modules = $$("myReports").getService("local").getModules();
modules.waitData.then(function(){
 const arr = modules.serialize(); // get array of modules
  /*[
      {
        id: 22
        name: "Company per region"
        text: "{
          "desc":"Created on 10/28/2020",
          "data":"companies",
          "joins":[...],
          "query":"",
          "columns":[{"id":"companies.region_id","name":"Region",...],
          "group":{"by":[{"id":"companies.region_id"}],"columns":[...]},
          "buckets":
            [{"column":"sales.product","options":[{"id":"Drinks",
            "values":["black tea","espresso","latte","green tea"]},{"id":"Other"}]}],
          "meta":{"freeze":1},"sort":null}",
        updated: "2020-10-29T12:38:14Z"
      },
  ...
  ]*/
});
Getting Models
Models are data sources for reports. All models are stored in a DataCollection. The collection is accessible via the getModels() method of the Local Data service. The method takes the only parameter:
- now (boolean) - if true, we assume that the directory is available on the client.
$$("myReports").getService("local").getModels().then(sources => {
 // do something with data sources
});
The method returns a hash of data sources:
Data example
{
  companies: {id: "companies", name: "Companies", data: [...], refs: [...]},
  persons: {id: "persons", name: "Persons", data: [...], refs: [...]},
  products: {id: "products", name: "Products", data: [...], [...]},
  sales: {id: "sales", name: "Sales", data: [...], refs: [...]}
}
To configure relations for models (data sources) you can set the "refs" property for a model. This is required for joining data after selecting the primary data source.
For example, the "sales" model contains the "refs" array with the following objects:
refs: [
   {id: 1, target: "places", source: "sales", name: "Place"},
   {id: 2, target: "products", source: "sales", name: "Product"}
   {id: 3, target: "persons", source: "sales", name: "Customer"}
],
It means that "sales" can be joined with the "places", "products" and "persons". Note that both the source and the target should have references to each other. The full data example is the following:
{
    "persons": {
        "id": "persons",
        "name": "Persons",
        "data": [ /*...*/ ],
        "refs": [
            {
                "id": 3,
                "target": "persons",
                "source": "sales",
                "name": "Customer"
            }
        ]
    },
    "sales": {
        "id": "sales",
        "name": "Sales",
        "data": [ /*...*/ ],
        "refs": [
            {
                "id": 3,
                "target": "persons",
                "source": "sales",
                "name": "Customer"
            }
        ]
    }
}
The model data items (table fields) should also contain the reference information. For example, "place_id" is a reference to the "places" model:
{id: "place_id", name: "Place", type: "reference", ref: "places",…}
Getting Queries
Queries are used for filtering reports. All queries are stored in a DataCollection. The collection is accessible via the getQueries() method of the Local Data service.
const queries = $$("myReports").getService("local").getQueries();
To make sure that the data are already loaded, use the waitData method to wait for a data promise.
Getting a particular query
const queries = $$("myReports").getService("local").getQueries();
queries.waitData.then(function(){
   queries.getItem(queries.getFirstId()); // get first query
});
You can get an array of all queries by serializing the collection:
Serializing queries collection
const queries = $$("myReports").getService("local").getQueries();
queries.waitData.then(function(){
 const arr = queries.serialize(); // get an array of queries
  /*[
      {
        id: 20,
        models: ["companies", "persons"],
        name: "myFilter",
        text: { ...query configuration },
        value: "myFilter"
      },
  ...
  ]*/
});
Related sample: Report Manager: Data Operations
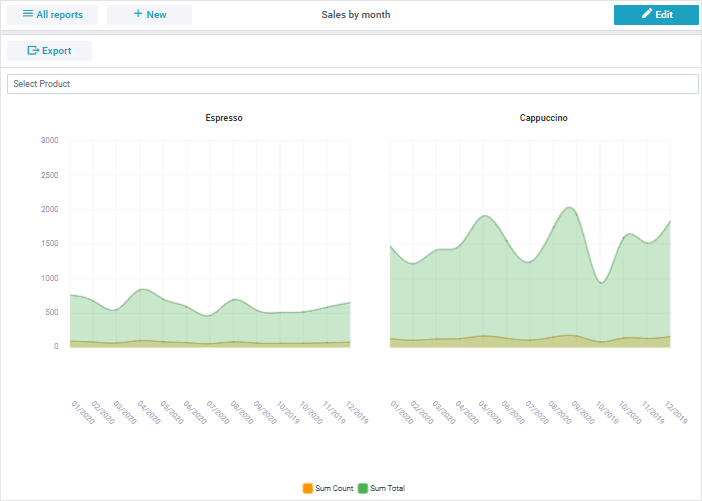
Creating Data Facets
Facets allow you to deliver multiple datasets grouped by particular values for a selected column.
For example, if we want to get faceting by the "Product" column that has the values "Espresso" and "Cappucino", the report should display two tables or charts (each table/chart should contain data for the "Product" facet).
To enable faceting, you should open the Data section of the editor module, switch on Facets and select the faceting column.
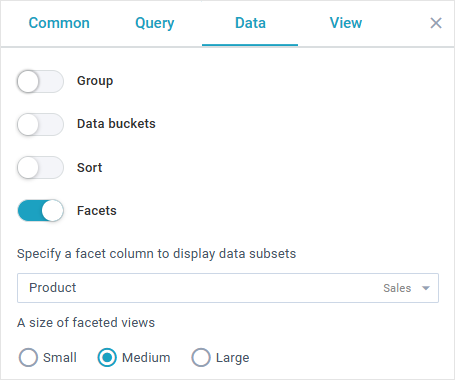
Here you can also set the size of facets:
- "large" ("l") - facets are located in one column and take all the available width
- "medium" ("m") - facets are displayed with the 500px minimal width
- "small" ("s") - this size requires 320px as min width for facets
After facets are set, the module configuration object gets two new properties:
- facets - (array) an array of column ids (now there is support for one column only)
- facetSize in the "meta" module object property - (string) can be "l", "m", "s", depending on the selected size
The facets array is included into the "data" request. For example, form data can be the following:
columns: ["sales.count","sales.saledate","sales.total"]
facets: ["sales.country_id"]
...
In this case the response is an array of facets. Each facet object includes two properties:
- data - (array) the dataset of the facet
- facets - (array) an array with the facet options: column id and column value
For example:
[
  {
     data: [{sales.count: "4", sales.saledate: "2022-10-06T00:00:00Z"},…],
     facets: [{column: "sales.country_id", value: "1"}]
  },
  {
     data: [{sales.count: "3", sales.saledate: "2012-10-06T00:00:00Z"},…],
     facets: [{column: "sales.country_id", value: "2"}]
  },
  {
     data: [{sales.count: "2", sales.saledate: "2012-10-06T00:00:00Z"},…],
     facets: [{column: "sales.country_id", value: "3"}]
  }
]